
In the world of computer science, data structures play a critical role in efficiently managing and processing large amounts of data. Different data structures are designed to solve specific problems and perform specific operations, from storing and retrieving data to estimating the frequency of elements and identifying the most significant items in a stream of data.
In this blog post, we will explore four popular probabilistic data structures: Bloom filters, Count-Min Sketch, Top-K and HyperLogLog. We will discuss how each data structure works, their respective advantages and limitations, and their real-world use cases.
Whether you are working with large datasets, performing network analysis, or developing a recommendation system, understanding the characteristics and applications of these probabilistic data structures can help you optimize your data processing and analysis. So let’s dive in and explore the exciting world of probabilistic data structures!
Bloom Filter
The bloom filter is my personal favorite. Not only because of the wide variety of real world use cases, but also because it is easy to understand.
A Bloom filter is a probabilistic data structure that allows efficient membership tests for a set of items. It can tell you when an item definitely does not exist in a set or when it probably does.
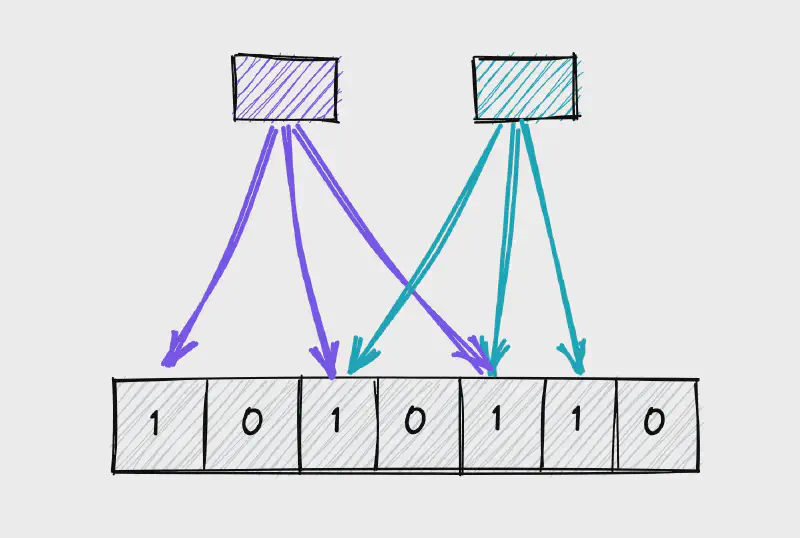
Imagine you have a big list of items, like a list of words or names. A Bloom filter is a clever way to quickly check if a new item is in that list.
When you create a Bloom filter, you give it a certain size (like a certain number of boxes). When you add an item to the filter, it does some fancy math (using something called hash functions) and puts a mark in some of those boxes.
Then, when you want to check if a new item is in the list, you give it to the filter. The filter does the same fancy math to see which boxes the item should have marks in. If all the boxes it should have marks in actually have marks, then the filter says “yes, this item might be in the list.” If any of the boxes don’t have marks, then the filter says “no, this item is definitely not in the list.”
Bloom filters are really good at doing this quickly, even if the list is very long. But they can sometimes make a mistake and say an item is in the list when it’s not (or vice versa). However, the bigger the filter and the smarter the fancy math, the less likely it is to make a mistake. Often this is good enough because you avoid pulling from your database most of the time and only need to pull to check an item actually exists.
Bloom filter real world use cases
-
Spam Filtering: Many email services use Bloom filters to quickly filter out spam messages. The filter can check the sender’s address and the message content against a set of known spam criteria, without having to access the full email content.
-
Web Caching: Web browsers and content delivery networks (CDNs) use Bloom filters to cache frequently accessed web pages. The filter can quickly check if a requested page is in the cache by looking up its URL in the Bloom filter. If the page is found, it can be retrieved from the cache.
-
Duplicates Removal: Bloom filters can be used to detect duplicate entries in large datasets, such as phone numbers or email addresses. By checking if an item is already in the filter before adding it to the dataset, the filter can help ensure that there are no duplicates.
Count-Min Sketch
Count-Min Sketch is used to estimate the frequency of items in a stream of data. It is similar to a Bloom filter in that it uses a hash table to represent a set of elements, but instead of just setting bits to 1, it increments counters in the hash table for each element encountered in the stream.
Count-Min Sketch uses multiple hash functions to hash items to different locations in the hash table. Each hash function increments a corresponding counter in the hash table for the item’s hash value. When querying the frequency of an item, all of the counters that correspond to the item’s hash values are retrieved, and the minimum value is returned as an estimate of the frequency. The use of multiple hash functions and taking the minimum helps to reduce the risk of over-counting due to collisions.
Count-Min Sketch is useful in scenarios where the frequency of items needs to be estimated in a large stream of data, where the data does not fit in memory or is too expensive to store. It can be used for tasks such as traffic analysis, anomaly detection, and detecting popular items in recommendation systems. It is also useful in scenarios where the data is changing frequently, as it allows for efficient updates and supports the removal of items.
Count-Min Sketch real world use cases
-
Network Traffic Monitoring: Estimate the number of packets and flows in a network. By counting the number of occurrences of specific packet or flow identifiers, such as IP addresses or port numbers, the filter can provide insights into network usage and identify any unusual traffic patterns.
-
Web Analytics: Track website visitor behavior and measure the popularity of specific pages. By counting the number of page views, the filter can help website owners optimize their content and improve user engagement.
-
Fraud Detection: Detect fraudulent transactions in financial applications. By counting the number of occurrences of specific transaction identifiers, such as credit card numbers or account numbers, the filter can identify any unusual or suspicious activity.
Top-K
Top-K is a way to find the K most frequently occurring items in a list. Imagine you have a really long list of items, like a list of words people have used in a book, or a list of website page views. Top-K helps you quickly find the K most commonly used items in that list.
Top-K algorithms use a priority queue to store the items with the highest counts. When a new item is added to the set, if the item’s count is larger than the smallest count in the priority queue, the smallest item is removed from the queue, and the new item is inserted into the queue. This ensures that the priority queue always contains the top-k items with the highest counts.
This can be really helpful if you want to know, for example, the K most popular products on an e-commerce site, the K most frequent words in a document, or the K most popular search terms on a search engine. It can help you quickly identify the most important or relevant items in a large dataset.
Top-K is really good at doing this quickly, even if the list is really long. But it doesn’t give you all the items - just the K most common ones.
Top-K real world use cases
-
Search Engines: Identify the most popular search terms entered by users. By tracking the frequency of each search term, search engines can help users find the most relevant and popular results.
-
Social Networks: Identify the most active users on a social network. By tracking the number of posts, likes, and comments for each user, the network can identify the most influential and engaged users.
-
Web Analytics: Identify the most frequently accessed pages on a website. By tracking the number of page views, the website owner can optimize their content and improve user engagement.
HyperLogLog
HyperLogLog is a clever way to estimate the number of unique items in a very large list, like a list of website visitors or a list of search terms. Imagine you have a really long list of items, and you want to know how many unique items are in that list. HyperLogLog helps you estimate that number without having to look at every single item.
Here’s how it works: you give HyperLogLog the list of items, and it uses some math to estimate the number of unique items. It does this by dividing the items into groups and counting the number of distinct items in each group. Then, it combines the counts from each group to estimate the total number of unique items in the list.
HyperLogLog is really good at doing this quickly and efficiently, even if the list is really long. It’s also very memory efficient, which means it can estimate the number of unique items in a list without using up too much space.
HyperLogLog is useful in many applications, such as counting the number of unique website visitors or measuring the size of social networks. It can help you quickly estimate the number of unique items in a very large dataset, without having to look at every single item.
HyperLogLog real world use cases
-
Advertising: Estimate the number of unique users who have viewed an online advertisement. By applying HyperLogLog to the list of user IDs who have seen the ad, advertisers can estimate the reach of the ad campaign and measure its effectiveness.
-
E-commerce: Estimate the number of unique customers who have purchased a product on an e-commerce platform. By applying HyperLogLog to the list of customer IDs, the platform can estimate the number of unique customers and monitor the popularity of different products.
-
Internet of Things (IoT): Estimate the number of unique devices connected to an IoT network. By applying HyperLogLog to the list of device IDs, network administrators can estimate the number of unique devices and monitor the network’s growth and usage.
These are just some of the most common probabilistic data structures. I’ll admit, I wasn’t even aware of these until later in my career. Once I found them, they changed how I build performant systems forever. Give these a whirl and let us know what you think! We’ll follow up with how to implement some of these in future articles.
Happy coding!